Content Type: guide
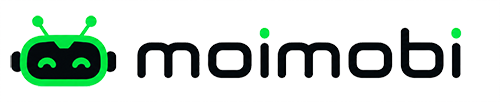
Cloud dashboard monitoring is the practice of using device fleet software to track device status, ownership, task activity, errors, and workflow readiness across a device fleet. For operations teams, the point is not only seeing more screens. The point is replacing scattered manual checks with a repeatable review system that shows which devices need attention first.
Manual monitoring usually starts small. Someone opens a spreadsheet, checks one device after another, asks teammates which account is logged in, and tries to remember which device was used for which task. That can work for a few devices. It becomes fragile when the team runs many Android environments, social accounts, customer reply workflows, or mobile execution jobs.
Good device fleet software changes the operating model. It gives the team one place to inspect inventory, assign ownership, review failed tasks, and decide what to pause, retry, or hand over. For teams using a cloud phone layer, the dashboard also becomes the place where mobile environments, account roles, and execution logs stay visible.
Key Takeaways
- Cloud dashboards replace manual device checks by turning device status, ownership, task progress, and exceptions into one shared operating view.
- Device fleet software is most useful when the team runs repeated workflows across many accounts, not when one person checks one temporary device.
- The dashboard should show inventory, environment health, task history, responsible owner, and the next action for failed or paused work.
- A dashboard is not a replacement for SOPs. It works best when each device, account, and workflow has a clear owner and review cadence.
What Device Fleet Software Changes in Monitoring
Device fleet software is a system for tracking multiple devices, environments, and tasks from a central dashboard. In a mobile operations team, that dashboard usually answers five questions: which devices exist, who owns them, which accounts run on them, what tasks are active, and which exceptions need review.
Manual device monitoring answers those questions one by one. A dashboard answers them as a live operating queue. Microsoft Intune describes managed device views as places where administrators can inspect device properties, hardware details, app information, compliance status, and configuration results in one admin center. That same operating idea applies beyond IT fleets: the team needs a shared inventory before it can manage repeated execution reliably. See Microsoft Learn's page on viewing device details in Intune.
The practical shift is from memory to state. Instead of asking "Who used Android-12 yesterday?", the dashboard should show owner, assigned account group, last activity, failed task count, and whether the environment is ready for the next workflow.
| Manual check | Cloud dashboard replacement | Why it matters |
|---|---|---|
| Open each device one by one | Fleet status list | Shows online, offline, busy, or failed devices quickly |
| Ask who owns the account | Owner and role fields | Reduces duplicate work and handoff confusion |
| Check screenshots manually | Task receipts and activity logs | Creates a review trail for repeated workflows |
| Guess which device is healthy | Readiness and exception flags | Helps teams pause, retry, or reassign work sooner |
Why Device Fleet Software Matters for Operations Teams
The common misunderstanding is that dashboards are only for IT asset tracking. For online operations, the dashboard is also a workflow control surface. It connects device inventory to task execution, account ownership, and review loops.
Android Enterprise explains that organizations use management solutions to visualize device inventory, enforce policies, distribute apps, and manage devices through a console. Features vary by management solution and Android version, but the management model is clear: a fleet needs inventory, policy, app, and device controls in one place. The official Android Enterprise guide summarizes this in its section on getting started with Android management.
For a social media, e-commerce, or customer engagement team, the same principle becomes operational. A device may be tied to one platform, one region, one account role, or one customer support lane. Without a dashboard, those assignments live in chat messages and spreadsheets. With device fleet software, they become fields the team can inspect before starting work.
This matters most when work repeats. Publishing, reply handling, monitoring, lead follow-up, and app-based checks all create small status changes. A dashboard keeps those changes visible enough for managers to catch failure patterns before they become a week of wasted labor.
Where Cloud Dashboards Fit a Phone Farm Infrastructure
A remote device farm without a dashboard is just a group of devices. A managed fleet with a dashboard is closer to operating infrastructure. The difference is whether the team can assign, inspect, and recover work without relying on one operator's memory.
For fleet-level mobile infrastructure, the dashboard should sit above individual mobile environments. It does not need to replace every human decision. It needs to expose the state that humans need before making the next decision.
Useful dashboard fields usually include:
- Device name, group, platform, region, and assigned role
- Account or workspace linked to the device
- Online status, last heartbeat, and last successful task
- Current task, queued task, failed task, and retry status
- Owner, reviewer, and escalation contact
- Notes about login state, app version, proxy route, or environment issue
AWS Device Farm's remote access documentation shows why hosted device sessions need logs, screenshots, and session results for review. It describes browser-based remote interaction with devices and mentions logs, screenshots, and video recordings as session outputs. That is a testing example, but the operating lesson is broader: remote device work needs evidence, not only access. See AWS documentation on remote access in Device Farm.
Preflight Checklist Before Moving from Manual Checks
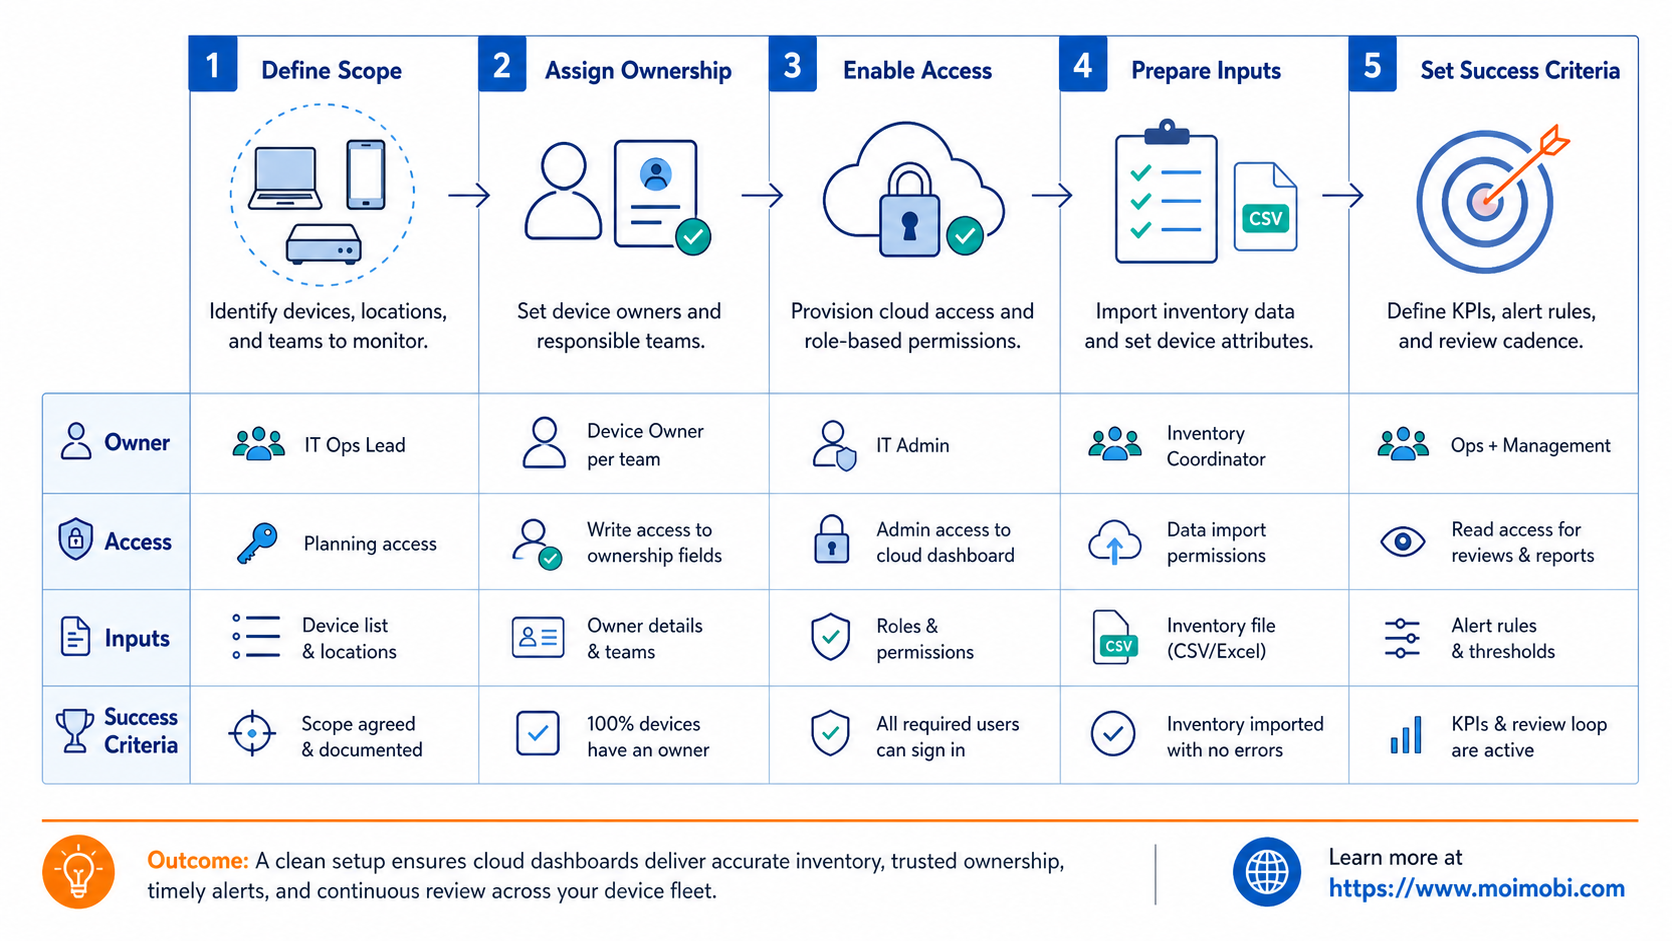
Moving to dashboard-based monitoring works better when the team cleans up the operating model first. A dashboard cannot fix unclear ownership or mixed account use by itself.
Use this preflight checklist before replacing manual monitoring:
- Name every environment clearly. Use names that encode platform, role, and sequence, such as
ig-support-03ortiktok-monitor-12. - Assign one owner per device group. Shared ownership causes slow recovery because nobody knows who should act.
- Separate account roles. Do not mix publishing, support, testing, and admin work in the same environment without a reason.
- Define task states. At minimum, use queued, running, paused, failed, needs review, and completed.
- Record failure reasons. A failed task without a reason becomes another manual investigation.
- Decide escalation rules. Set who handles offline devices, login prompts, app updates, and repeated workflow failures.
Moimobi's separated device workspace model fits this preparation step because the dashboard should reflect separated environments, not one shared pool where every account can drift into every device.
How to Get Started with Dashboard Monitoring
Start with a small pilot instead of moving the whole fleet at once. Choose one workflow with clear boundaries, such as daily account readiness checks, scheduled content preparation, or customer reply follow-up. Then connect only the devices used by that workflow.
The first setup pass should focus on visibility:
- Create device groups by platform, account role, or region.
- Add owner and reviewer fields for each group.
- Map each device to one account workspace.
- Define the exact task states that appear in the dashboard.
- Add a review view for failed, paused, and stale tasks.
- Run the workflow for a week and record every manual question the dashboard did not answer.
The second pass should focus on action. Once the team trusts the status view, add task controls such as pause, retry, reassign, or request human review. Keep these controls narrow at first. A dashboard becomes risky when it lets operators trigger broad actions without showing enough context.
For teams that run repeated mobile work, controlled mobile execution routines should connect to dashboard states. The dashboard should not only say a task failed. It should show whether the issue was environment readiness, app state, login state, routing, or workflow logic.
Common Mistakes to Avoid
The first mistake is treating the dashboard as a prettier spreadsheet. A dashboard should reduce decision time. If operators still need five chat messages to understand each failed device, the schema is incomplete.
The second mistake is tracking devices without tracking work. A device can be online and still not ready for the next task. The dashboard needs task state, account role, ownership, and recent failure history.
The third mistake is adding too many controls too early. Large retry buttons, bulk actions, and automated restarts can create new confusion if the team has not agreed on stop rules. Start with visibility, then add controlled actions.
The fourth mistake is hiding exceptions under success counts. A manager needs to see stale devices, repeated failures, and unresolved reviews. A dashboard that only shows completed work will not replace manual monitoring because humans will still need to search for what went wrong.
A fifth mistake is skipping baseline data. Before a team trusts trend views, it needs a clean starting point for device names, owners, account groups, and common failure codes. Without that baseline, the dashboard may look organized while still carrying the same confusion that existed in the manual process.
Verification Checklist: Did the Dashboard Replace Manual Monitoring?
A dashboard has replaced manual monitoring only when daily operations no longer depend on private knowledge. The test is simple: a new reviewer should understand the fleet state without asking the previous shift what happened.
Check the result against these signals:
- Every device has a clear owner and role.
- Failed tasks show a reason or next action.
- Offline devices appear in a visible exception queue.
- Account groups map to device groups without ambiguity.
- Reviewers can find last activity without opening every device.
- Operators know when to pause, retry, reassign, or escalate.
- Weekly review finds patterns across devices, not only isolated incidents.
If these checks fail, do not add more automation yet. Improve the fields, states, and review rules first.
Frequently Asked Questions
What is device fleet software?
Device fleet software helps teams manage multiple devices or cloud environments from one operating view. It typically tracks inventory, ownership, status, policies, and activity.
How does a cloud dashboard reduce manual monitoring?
It brings device status, assigned roles, active tasks, and exceptions into one place. Operators spend less time opening each device just to know what happened.
Is this only for IT teams?
No. IT teams use fleet dashboards for endpoint management, but operations teams can use similar concepts for social media, e-commerce, customer support, and mobile workflow execution.
When should a team keep manual checks?
Manual checks still fit small pilots, sensitive reviews, and workflows where human judgment is required. A dashboard should support those decisions, not erase them.
What should appear on the first dashboard?
Start with device name, owner, group, account role, online status, current task, last activity, and failed-task reason. Add more fields only when they improve decisions.
How does this relate to account isolation?
Account isolation works better when each account has a clear environment and owner. The dashboard helps teams see whether those assignments are still clean.
Can dashboards replace SOPs?
No. A dashboard displays state. SOPs define what the team should do with that state. The two should be designed together.
What is the safest first pilot?
Pick one repeated workflow with limited scope, such as readiness checks or reply follow-up. Track it for one week before adding broad controls.
Conclusion
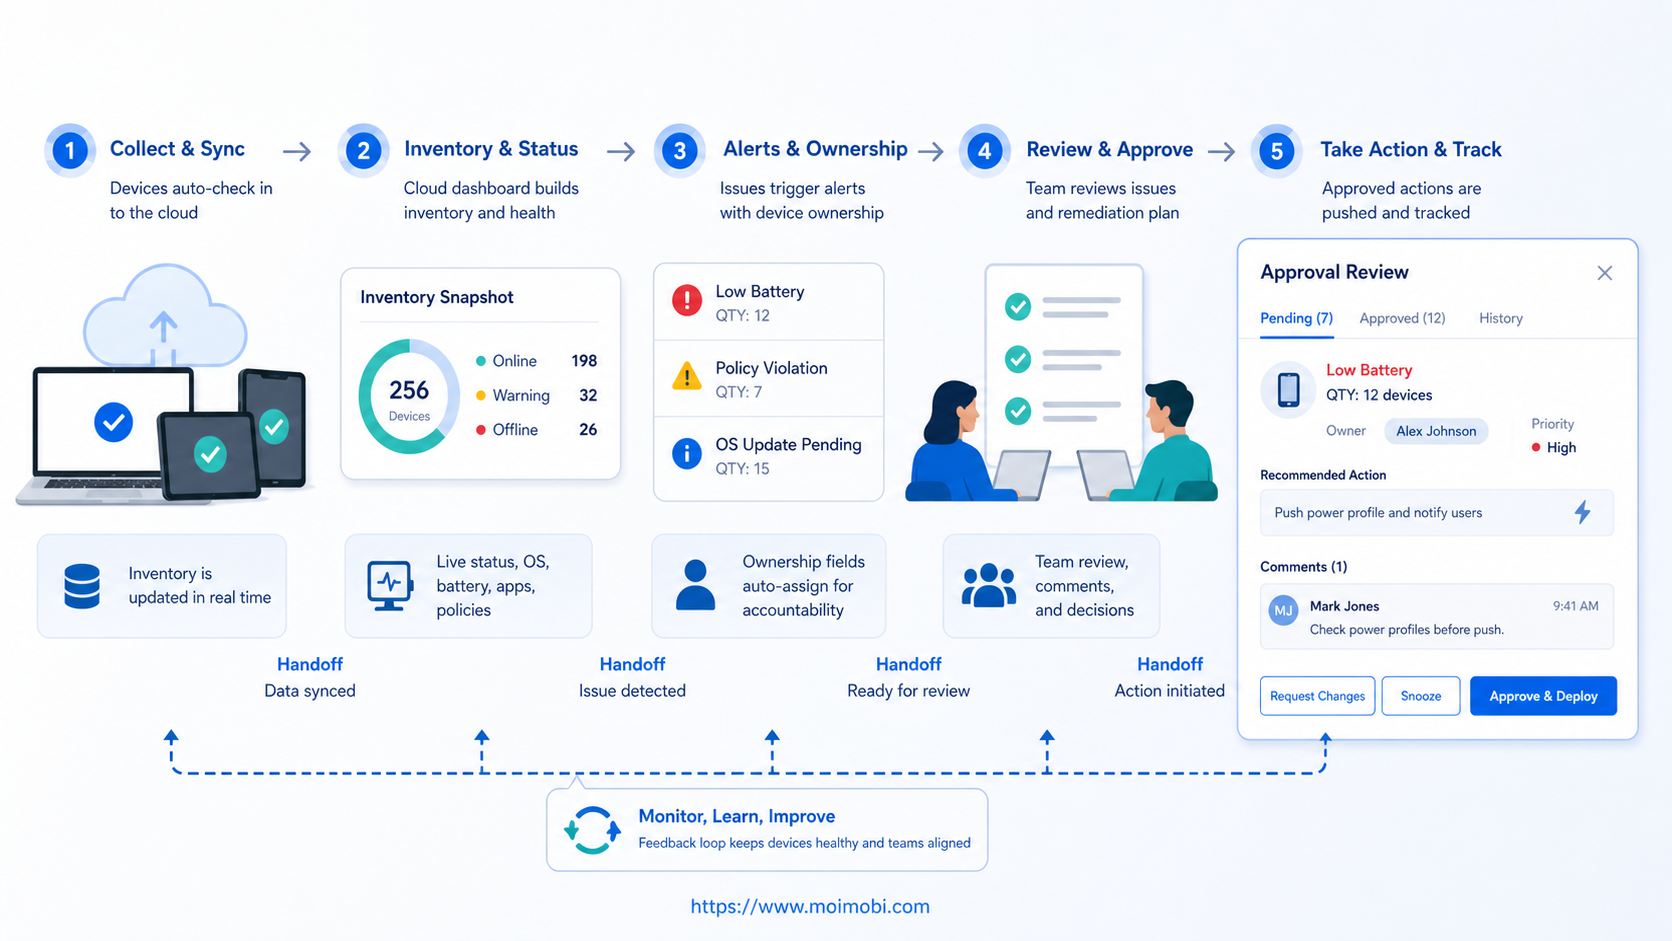
Cloud dashboards replace manual device fleet monitoring when they turn scattered checks into shared operating state. The priority order is simple: first define inventory, then assign ownership, then expose task status, then track exceptions, then add controlled actions.
For a team evaluating device fleet software, the next step is not buying more devices. The next step is mapping the current manual questions. If the dashboard can answer those questions faster, with clearer ownership and better recovery context, it is ready to carry more of the monitoring workload.